XBRL Analytics
XBRL Financial Reporting & Analytics
The power of Data Modelling and Business Intelligence meets the nuanced complexities of Prudential Regulation.
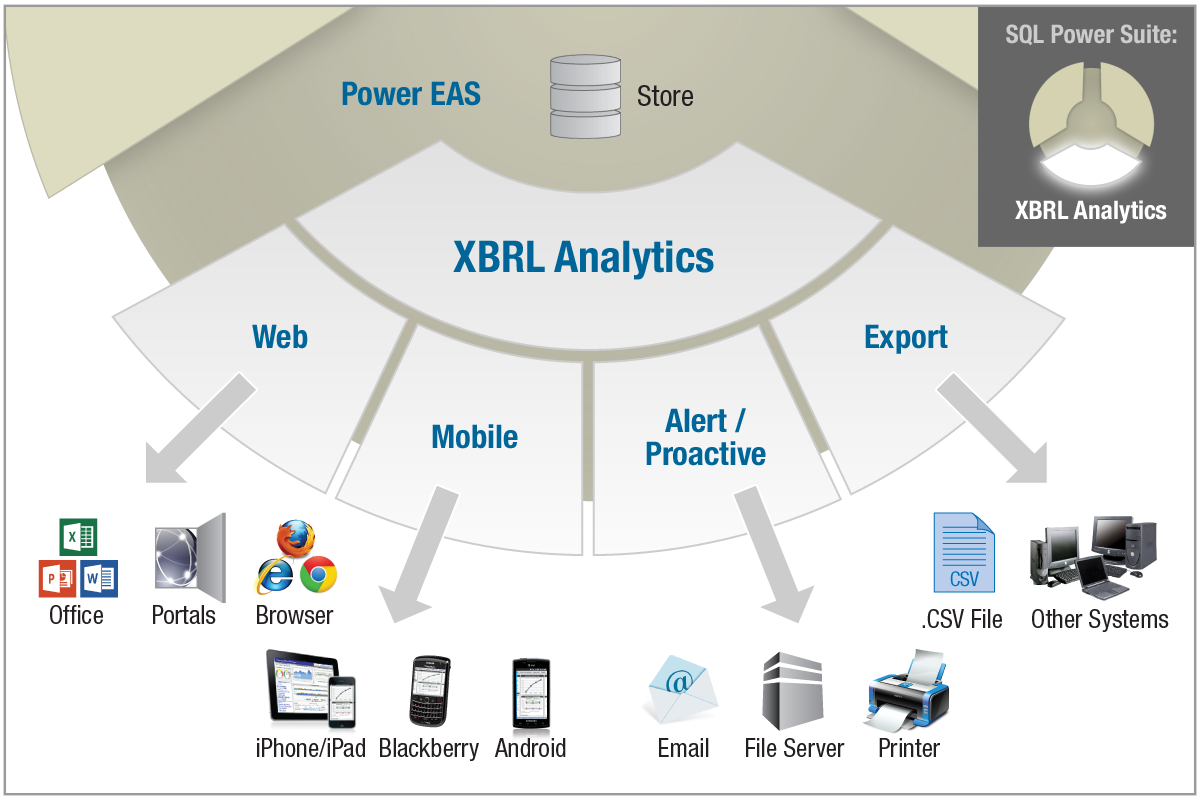
SQL Power XBRL Analytics is a fully optimized analytics appliance for financial analysis, data mining, and report distribution. It comes pre-built with dynamic validation and parsing capabilities as well as extraction, transformation and load (ETL) technology to import XBRL instance documents and multiple related taxonomies.
XBRL Analytics is commercially available off-the-shelf and offered as a turn-key, stand-alone appliance or grouped together with other modular SupTech Hub components to form a complete end-to-end prudential regulatory platform.
After collecting all the filers' business information in XBRL, organizations need to meet the growing demand for timely and accurate analysis and mining of these filings. Traditional, custom-built data warehouse solutions often take too long and cost too much to build, and do not contain the latest information required for timely decision-making. Furthermore, once the taxonomy changes, further development needs to occur to process and report against the new XBRL instance documents.
XBRL Analytics bundles SQL Power's proven ETL technology and XBRL parsing approach with an embedded Business Intelligence (BI) stack from MicroStrategy (NASDAQ: MSTR, the global leader in BI and mobile BI technology). XBRL Analytics transforms, loads, and then optimizes XBRL instance documents for further processing - sophisticated data mining, reporting, and analysis.
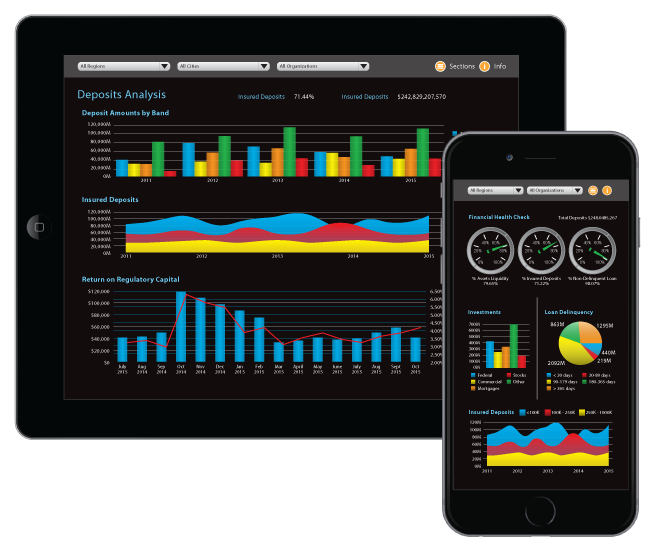
XBRL Analytics comes out of the box with pre-built MicroStrategy reports, graphs, and dashboards (including mobile versions) allowing for very quick deployments (usually in under 30 days). Further reports, graphs, dashboards, or mobile applications can be easily customized for specific organizational needs via the MicroStrategy stack. The XBRL Analytics platform enables a wide range of stakeholders worldwide to consume and examine comparable XBRL data quickly, easily, and efficiently.
XBRL Analytics Demo
CAMEL Dashboard
Predictive Modelling
Features of XBRL Analytics
- Flexible and extendable data architecture which can load any XBRL instance document and can address any XBRL Business Intelligence requirement.
- Supports summary level reporting and enables users to "drill anywhere" across the entire database, even down into low level transactional detail.
- Taxonomy Agnostic platform - XBRL Analytics works with any Taxonomy and can analyze filings across organizations, industries and taxonomies.
- XBRL Analytics uses a single common metadata for consistency and efficient maintenance.
- "Intelligent Cubes" (i.e. OLAP reports cached in-memory as data-sets) for in-memory analytics are supported by a 64-bit architecture.
- The solution is web enabled, includes Microsoft Office integration, outputs to publish to web as well as desktop (for developers).
- Mobile BI: Analyze your data anywhere with mobile reports and applications on your iPhone, iPad, BlackBerry or other smart phone/tablet.
- Metrics and attributes are created once and re-used across different types of reports.
- Changes are made in one place and updates are cascaded to all related reports automatically. Security permissions are handled in a similar fashion - i.e. granted in one place, reducing administration costs.
- Easily customizable to add new data, reports, graphs or dashboards to meet evolving regulatory organizations' Business Intelligence needs.


Capabilities
Explore your data and knowledge-discover using MicroStrategy's built-in data mining capabilities.
- Early warning analytics scenario and stress testing: Key financial thresholding, ratios and other indicators are provided in real time against submitted call reports and financial returns.
- Key plausibility assessments: Combined with threshold-based flagging identifies low probability data as compared against recent and historical trending.
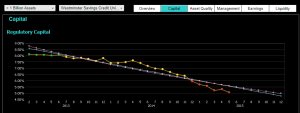
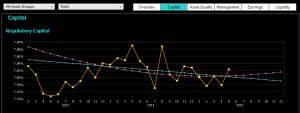
- Predictive Time Series patterning and trend Analysis: Analyzing individual financial institution data or data aggregated in a time series across sectors or financial institution groupings is easily accomplished, including autoregressive and moving average models, smoothing and curve fitting techniques, auto correlations, etc.
- Sector Analysis Breakdowns: Analysts can report share breakdown by industry group, financial or other institution against the market as a whole, including characteristics related to geographical location for instance or other combinations of third party data.
- Ad-Hoc Queries: Generate ad-hoc queries against the XBRL Analytics appliance and make them available to other members of the supervisory team.
- Corporate Profile Reporting and Risk Profiling: Report against summarized corporate profile data such as directors, beneficial owners as well as licensed products, etc. Aggregating risk information from the risk profiles of financial institutions also enables real-time risk based regulation through the quantified financial ranking of financial institutions by risk for improved supervision and inspection planning.
- Executive Management Reports/Dashboards: Dashboards provide senior level executives with a high level financial health check - risk, trend and market data or overall submission process stats and KPI tracking against supervisory and other divisional team members.
XBRL Analytics: Introduction
XBRL Analytics: Demo

Want to learn how SQL Power can help your financial regulatory organization be future-ready?